The Census Bureau has collected data on race since the very first census in 1790. Categories of race and ethnicity have changed a great deal over that time, reflecting changes in culture and society as well as the composition of...
The nation’s demographic mix is changing but what does that mean for Tucson? In recent years, demographics have shifted with the population aging and birth rates declining. In order to plan for the future, it’s important to understand how demographic...
Georgraphy Primer and Census Geography Layers for Tucson & Southern Arizona Do you know all the geographical regions in Southern Arizona? There are many and it is helpful to know specifically what they are. This article explores the geographic layers...
The Making Action Possible (MAP) Dashboard has done it again! MAP Dashboard coordinator Jennifer Pullen (center) accepts the 2018 Impact Award from CIC Board Members at the CIC conference awards ceremony in Minneapolis, MN, on September 18, 2018. The Community...
The MAP Dashboard recently released its inaugural Annual Report providing a snapshot of the MAP Dashboard as of spring 2018, using the most up to date data available. The report summarizes the latest results for all indicators and highlights key...
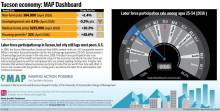
In 2016, the Tucson Metropolitan Statistical Area (MSA) ranked ninth out of 12 comparable western MSAs in the labor force participation rate for the working-age population (25-54). Tucson posted a 0.6 percentage point increase in the rate since 2009. The...
In 2016, approximately 12.6% of Arizonans had a disability. The percentage of the population with a disability in Arizona was nearly identical to that of the U.S. (See Table 1 below which provides population characteristics for individuals with a disability...
Did you know that the MAP explores race and ethnicity data across a wide selection of indictors? The list is long and includes Median Household Income , College Major , Educational Attainment , High School Graduation Rates , Student Achievement...